Event
2
min
The (Ugly) Truth About Backtests

Qaisar Hasan
Founder & CEO
I might be about to shoot myself in the foot.
Let me explain.
As founder and CEO of Maiden Century, a company widely viewed as the industry leader for determining data quality and efficacy within the asset management industry, I’m extremely proud of the work we’ve done to establish accurate, transparent, and vendor-agnostic methods for evaluating data quality through backtesting tools tested against company reported KPIs. Those backtests form the foundation for the predictive work our clients rely on to anticipate upcoming surprises to corporate earnings or product demand.
In other words, we live and breathe backtests. We even wrote a white paper recently on our unique approach to model construction that generated a great deal of debate amongst data practitioners within the investment industry. So what I’m about to say might come as a bit of a surprise, but it’s a conversation that needs to happen and a reality that needs to be acknowledged:
Backtests don’t tell the full story, and a blind overreliance can lead to missed opportunities.
I don’t make this statement lightly, given our position in the ecosystem. But having lived and worked with alternative data on the front lines for many years as a buy-side portfolio manager, and now as the head of a company that crunches numbers on behalf of our partners, I’ve been able to see many interesting things that aren’t always easily captured in a succinct backtest or benchmarking table.
Let’s unpack some of this.
Time to insight is the number of days and hours it takes for you to go from raw data to detecting the signal, extracting actionable insight and acting on it. In the early days of alternative data adoption (circa mid to late 2010s), money managers could generate returns by putting on a trade based on data as late as a couple of days before a company’s earnings announcement.
Those days are long gone.
Today, widespread data acceptance and adoption by the asset management industry means that by the time a company reports its key numbers on an earnings call, much of the “surprise” anticipated by the data has already been discounted into the share price via changes to “whisper” buyside expectations.
The extent of this market action absorbing the signal in data differs by region and sector. It’s most pronounced in US consumer sectors like retailers and restaurants, and much less so in B2B sectors like Energy and Industrials or outside the US, where data is not as prevalent, and where institutional investors’ data savviness is also generally behind the curve.
To fully monetize insights in increasingly competitive markets today, investors need to materially compress the ‘time to insight’. That’s why our Precast tool, which starts generating estimates on corporate KPIs up to six months in advance (before we have even a shred of data on the period), has become indispensable for our clients.
How does this play into the debate around backtesting? Backtests are typically made on the assumption that we had the full 100% of the data available ahead of time. Our backtesting methodology takes our estimates from one day before the earnings print, and compares those numbers to the reported actuals to determine the backtest efficacy. But in a world where investors increasingly need to react before having complete data for the period in question, such backtests are technically correct but not practically as relevant. Instead, I would argue we need to start considering backtest quality over a period an additional yardstick: Days before earnings.
The chart below shows our average model accuracy using this new yardstick. This data is based on the 5,000+ KPIs we forecast each day, using more than 100 datasets on the platform, for nearly 2,000 public companies spread across all major geographies and sectors.
Average MAPE (%) vs. Days to Earnings: US Consumer Sector and All Companies
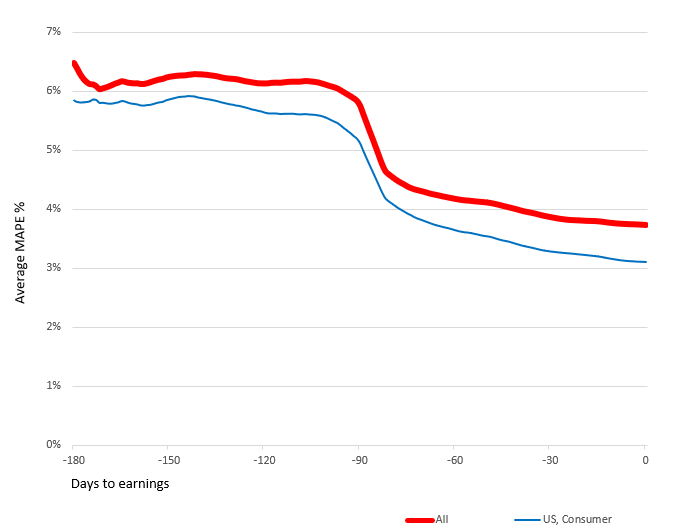
Two things are evident from this chart.
One, while accuracy naturally improves as you get more data for each period, there is valuable and monetizable information value starting several months before the broader market starts to focus on earnings risk. The measure we are plotting in the chart above is MAPE – the Mean Absolute Percentage Error, or in plain English, the absolute difference between an estimate based on an alt data model and what the company eventually reported on earnings day. The lower the MAPE, the more accurate the prediction. MAPEs are typically in the 2-3% range a day before earnings, but the 5-6% MAPEs seen up to six months in advance of the event are, in many cases, even more lucrative because none of the potential positive or negative earnings surprises has been factored into the share price at that point. This is especially true if the models are predicting a potential beat or miss that is well outside the typical MAPE range several months out. So while many investors will focus on a dataset that may deliver a tight 1-2% MAPE a day before earnings, but is much noisier in the lead-up, I would argue that an alternative dataset that is slightly noisier in the final analysis but produces a more usable estimate much earlier on can be an even more profitable tool.
Second, there are subsets of coverage where the confidence you can have in a forecast several months out is a lot higher than other subsets. While overall MAPEs 80 days out tend to be in the 4.5% range, the names with the highest quality data available data – US Consumer – are already approaching the sub-4% range by then.
Martha Stewart would be a great person to tap for Thanksgiving meal decorations tips, but would probably be terrible at helping you fix a clogged toilet. A qualified plumber would be a more effective – and cheaper – option.
Data is no different. Different datasets have different “competencies” and are good at predicting different things. Take Amazon as an example. US transaction data is great (in fact, ridiculously good) at predicting North American e-commerce sales for the company. And why shouldn’t it be? As an e-commerce platform, all transactions require the use of a credit or debit card. But try using the same dataset for predicting international sales, or AWS revenue, or even their nascent but rapidly growing ad sales business, and the backtests look terrible. Instead, other, more niche datasets are required to solve those puzzles.
Extending that Amazon example further, it’s clear that data can help you research several different areas of a business. You can look at different geographies, different distribution channels, and different product lines. As you can infer, not all of these KPIs are equally important in the eyes of investors. Some forecasts can be highly accurate but you can’t make a dime on the call – even when you bat a perfect 1.000 (using a baseball analogy). There is a bigger concept at play – and that is the opinion of Mr. Market on each KPI. We even created a metric that Maiden Century clients use to quantify this phenomenon. We call it ‘Model Relevance’ and it measures the extent to which the market reacts to surprises on any given KPI. In other words, it tells you if you can monetize insights from a particular prediction.
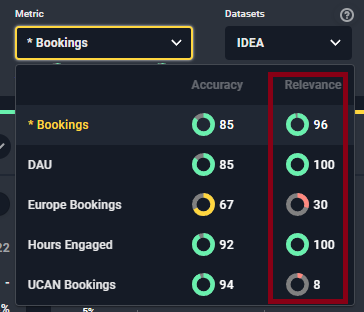
Why do some KPIs have relatively low relevance scores? Some companies guide well in advance, or the business is very transparent, or there is abundant data on it. A great example is Carvana (ticker CVNA), where anyone can build a quick web scraper to see how many cars move off the parking lot on a daily basis, and can therefore predict total sales almost in real time. Or it could be a KPI that is immaterial to a company’s valuation or strategy, perhaps because the company is highly regulated like a utility that makes money based on a guaranteed ROI on its capital. Or there could be an activist shareholder agitating for a spin-off or sale, in which case none of the KPIs for that company will matter.
Because not all KPIs are created equal, it stands to reason that not all backtests should be treated equally either. Sometimes a noisier backtest, on a KPI with a higher ‘model relevance’ score, may be more profitable for investors than a very accurate backtest on an inconsequential KPI.
Investors often pride themselves on being ‘data-driven’, measuring every aspect of a business that is trackable.
As human beings, we do the same thing in nearly every aspect of our lives. As a parent of two kids going through NYC private schools (don’t even get me started on the tuition), I can personally attest to the highly results-focused education children are subjected to today. Standardized test results can tell me how well my son knows his parallelograms, but they won’t tell me what’s most important – are we raising good human beings who will lead happy, fulfilled lives?
That same issue exists with investors’ use of data. Sometimes we can get infatuated by the act of measurement, rather than first asking if what we’re measuring is itself meaningful. Even management teams have arbitraged this to their advantage, often setting compensation targets that are narrowly focused on one or two metrics that can be manipulated in the short term, but to the longer term detriment of the company’s value: Want to hit EBITDA goals to get that big stock grant? No problem. Cut back on customer service. By the time those problems catch up to you, the CEO may be long gone, riding off into the sunset with a hefty stock grant.
The bottom line is, we often value what we measure when we should be measuring what we value. Just because some things are harder to measure (brand value, customer goodwill, competitive positioning), they shouldn’t lose their relevance in an increasingly data-driven world. But there’s a real risk this is already occurring.
A related concept is the time horizon investors are willing, or able, to look out. Many longer-term investors often complain to me that they don’t use data because it’s too short-term focused. While I disagree with this perspective – there are lots of ways to leverage data to understand mid to long-term themes as well, albeit you must work harder to uncover them – there is something to the argument that data causes us to lower the focus on inherently qualitative aspects of a business. Unless we can find the right middle ground here, we run the risk of developing an over-reliance on short-term signals that fail to capture elements central to a company’s future growth. Such an outcome will be a genuine setback for our industry.
As data sources grow in number and complexity, and the underlying technology improves, backtests are themselves becoming more complex and nuanced. Standard industry practice to date has been to backtest data sources in isolation, with the aim of answering a binary question: Should I buy dataset A or not? This decision is often based on benchmarking dataset A versus a group of its peers.
Increasingly, our experience suggests the right question should be: what happens to my backtests when I combine dataset A with my existing portfolio of datasets? Or if I were to remove one of my current subscriptions from the portfolio of datasets?
You’d be surprised at how different of a backtest you can get when you start combining datasets together. Given our position in the middle of some of the world’s largest data buyers and sellers, we’ve seen that relationship play out in clear, quantifiable terms. As the chart below shows, there is a very clear and measurable improvement in forecasting accuracy as additional inputs are layered on top of each other.
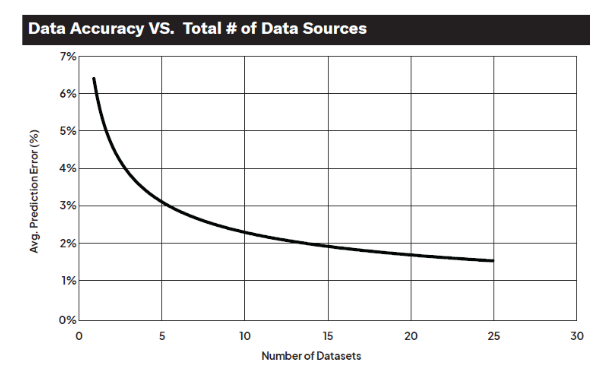
Of course, combining data is not trivial and it has to be done in a thoughtful way – mixing somewhat “noisy” standalone app, web, customer survey, and transaction datasets can often yield much more interesting and accurate forecasts than throwing ten highly accurate transaction datasets – all subject to the same inherent biases – together.
This makes intuitive sense. Fundamental investors never invest in a company without building a comprehensive mosaic of information from customers, suppliers, former employees, current management, industry experts etc. Why should data-driven investors approach investing any differently? Diverse sources of information should – and do – drive more reliable forecasts. Empirically, our data and experience confirm this intuition.
Data-driven forecasting has been a game changer in the field of investing, with most of the world’s largest hedge funds now having built out deep benches full of PhDs to help fulfill its promise. Central to that effort has been the backtest.
But the more time you spend amidst this highly quantitative evaluation process, the more you realize the need for nuance and smell tests. In a sense, this mirrors the circle of life; to become more quantitative, we must be willing to become more qualitative, and continue to trust our instincts as much as the backtest.
What are your thoughts on backtests as a tool to build conviction in your models? How much do you rely on them? We would love to hear from you.