1 min read
Using Alternative Data for Macro Economic Analysis to Improve your Investment Thesis

Mark Trowbridge
VP, Sales


Using Alternative Data for Macro Economic Analysis to Improve your Investment Thesis
Context is everything.
-D. Garrett
Some investment managers invest “bottom-up,” while others prefer to invest “top-down,” identifying an industry and filtering down to the companies that meet their unique investment criteria. No matter your style, before you invest, you need to be aware of what is happening in the market your company participates in. Is the industry growing, shirking, consolidating, or exploding? This context describes the landscape and opportunity set for your company, and that context is key.
Taking it one step further, imagine you are writing an investment thesis or pitching a new stock idea to your PM. Before the initial pitch, you must formulate the background story for your proposed investment and develop an overarching view of the market the company serves. Call it a narrative – the more compelling your narrative, the more likely your PM will hear you out. Enhancing your narrative with relevant context will make your pitch a lot more compelling.
This context is something Alternative Data can help you with, perhaps even more so than you think.
Not all managers know that broad, thematic analysis of industries and sectors (aka macro analysis) is no longer the realm of traditional market data alone. In fact, Alternative Data can offer two key benefits that are not present in publicly available macro KPIs: timeliness and granularity. These two elements can add just the context your investment thesis needs.
Timeliness of Alternative Data allows for Nowcasting
When conducting investment research, it is imperative to analyze the most recent data as consumer behaviors and preferences can shift abruptly in today’s hyper-paced economy. A term born from meteorology has made its way into economics over the last decade: Nowcasting. This is the practice of analyzing macroeconomic indicators such as GPD and Inflation in near real-time, often beating official estimates by weeks or even months.
One of our data partners, Yodlee, tracks de-identified consumer spending data and then aggregates the data by industry. This allows analysts to track indicators of consumer health such as total consumer spend, average spend, and even estimated inflation numbers by industry. An example we recently wrote about in our whitepaper is shown below.
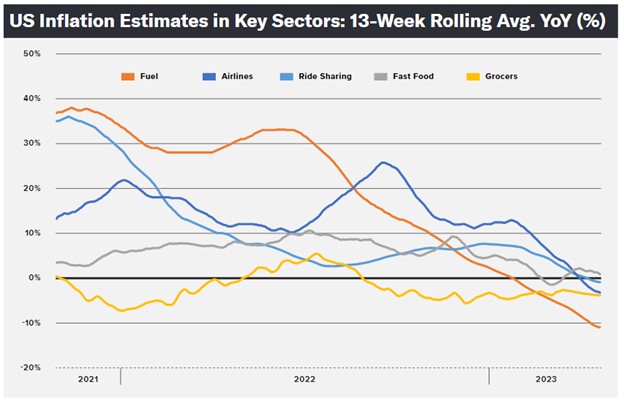
Source: Yodlee
The data shows estimated inflation numbers aggregated by key sectors with only a few days lag. In addition, the data points are daily, allowing the analyst to see the ebbs and flows in high definition.
It’s important to keep in mind that Alternative data is not meant to replace traditional data sources but rather to complement them. By integrating Alternative Data into nowcasting models alongside traditional data, investment managers can gain a more comprehensive, timely, and accurate picture of the market and the condition of the consumer. This combination allows for more robust analysis and a more compelling investment thesis, and actual data can serve as a benchmark when it eventually becomes public.
Granularity of Alternative Data allows for Better Storytelling
Alternative Data, specifically transaction data, has been used to tell a coherent story about the economic recovery post-COVID-19. Traditional economic indicators and reports provide aggregated information, making it challenging to capture all the nuances and fluctuations in the KPIs. Alternative Data sources, on the other hand, allow for the analysis of specific consumer behavior, specific industries, and localized trends. This granularity helps investment managers identify emerging patterns and make more accurate predictions and build much more compelling narratives about an industry or a particular investment.
One prominent example can be found in the consumer retail space. Let’s say that you are writing your thesis on a retailer that is going through a period of growth as customers flood their locations. Is increased visitation a broader trend that all retailers are experiencing, or is this retailer an outlier? In this case, foot-traffic data proves useful in gauging broad visitation to all retail outlets and serves as a benchmark for your investment idea. By aggregating data from thousands of locations into a “basket,” investment managers gain macro-level insights and then zoom in on a particular sub-industry. Adding credit card data to the mix can inform you on whether visitation translates into sales. These nuanced insights are simply not possible with traditional data alone and can add a lot of powerful insights to your investment thesis.
We have recently published an article that covers other lesser-known use cases for Alternative Data.
If you are not considering all the potential applications of this data, you may be leaving a lot of money on the table.

Learn about other use-cases for Alternative Data in our latest article.
Ready to talk to us? Reach out to us and help level the playing field for your team.