5 min read
How to Generate Alpha with Alternative Data Even if You Only Have One Dataset

Don Wood
CRO


All you need is one
You may only subscribe to one dataset, but that should not stop you from consistently generating Alpha with Alternative Data. There is still plenty of Alpha to be generated across sectors, even within the highly covered consumer space. The key is in the way you analyze the data.
In this article, we will explain how investors can use a single dataset to form a contrarian view that can be more predictive than the standard models for certain KPIs. Not only will this give investors an edge over those who do not use data, it may give them an edge over investors who use a popular dataset in the most common way. We will be using the Analytics tab on the IDEA platform to work through some examples.
The important concept to understand is that Alternative Data is complex and multi-dimensional. Unlike traditional datasets, like, say inflation statistics, where most economists agree on a standard methodology, Alternative Data can be cut a myriad different ways and there is no “right” way that works for all companies and KPIs. Furthermore, it is not uncommon for two analysts to come up with polar opposite views on the same investment using the same dataset. For instance, you can take a popular transaction dataset and create different cohorts (I.E. only look at shoppers with over 2 years of spending history) and different demographics to come up with diverging views. There are also different ways of controlling for various known biases in the data, assigning weights to model factors, and so on.
This is both a challenge and an opportunity. The tough part is knowing how to cut the data in a way that yields the highest quality predictions for each KPI. On the plus side, this offers investors an advantage over others who may choose to only consider a “standard” cut of the data recommended by the vendor for all their KPIs. In the case of Alternative Data, one size does not fit all, but that is exactly how most resource-constrained investors approach data. This leads the market to form a consensus view and with the right tools and process your view can be both different and most importantly, better.
This is the concept behind the Analytics tab on the IDEA platform. Let’s take a closer look.
Analytics Tab and Forecast Faceoff
Clients can navigate to the Analytics tab after logging into IDEA. If you do not have that tab turned on, or would like a quick demo, please contact us.
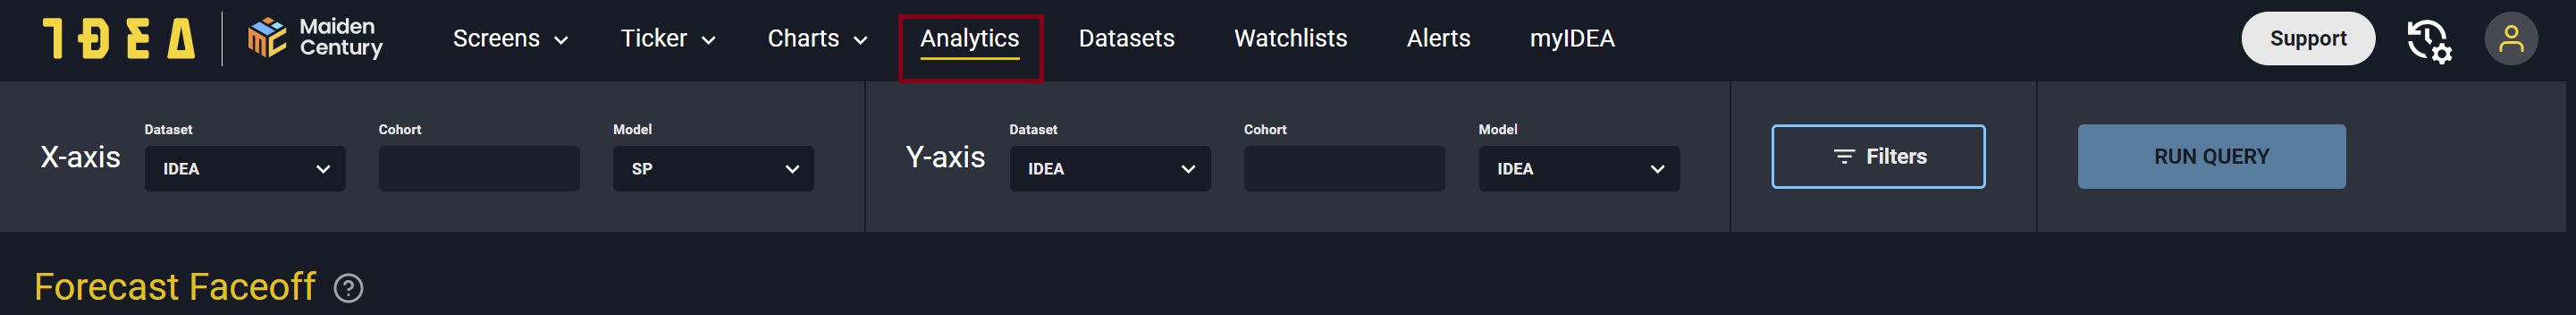
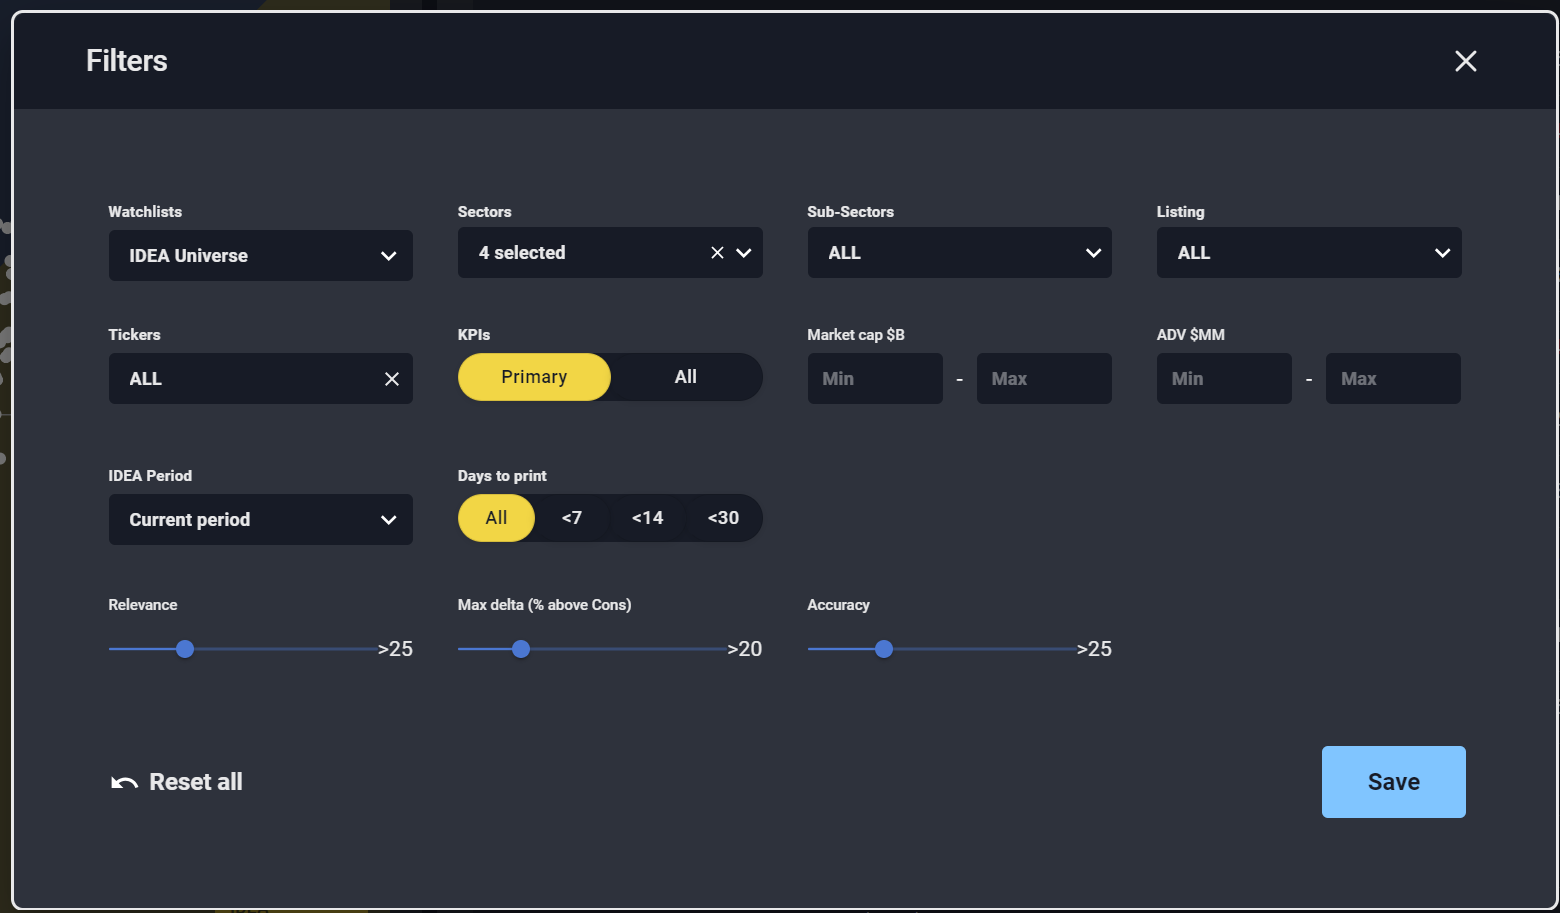
Upon logging into IDEA, on the top of the screen you’ll find the control ribbon where you can select your dataset, model, and cohort. There is a filter for a quick way to focus on just the results in your interest sectors and models with high accuracy and relevance scores.
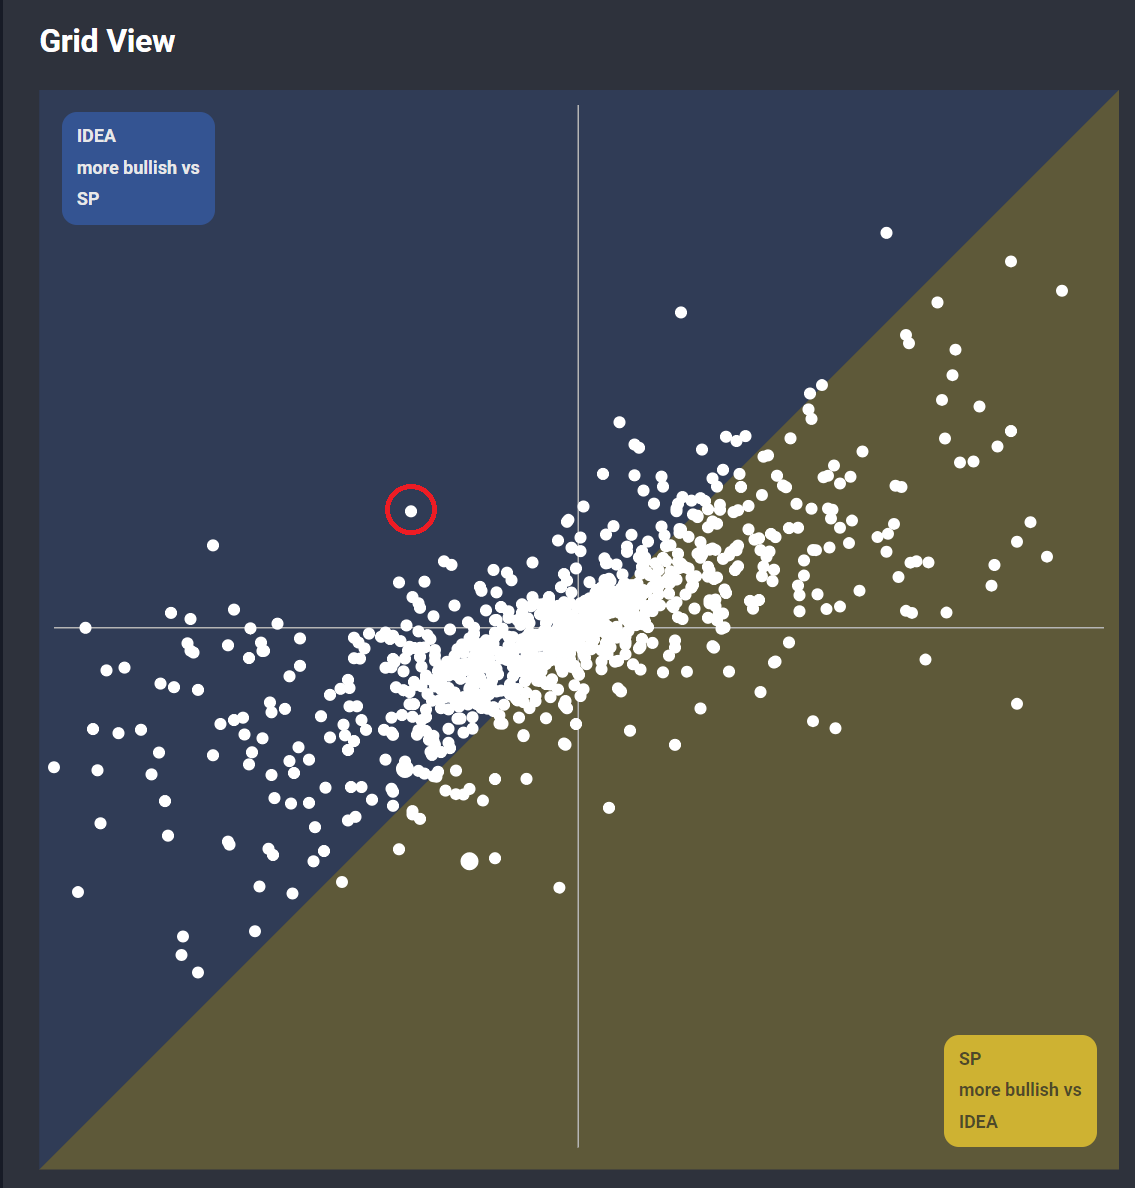
The main view on the analytics tab is called the Forecast Faceoff. It consists of a scatter plot and a table that is linked to the data points in the plot. This allows you to visually discover variations or gaps in estimates across different types of data sources, dataset cohorts, and statistical models.
The values in the table and chart show Delta to Consensus, which means the difference between our estimates and consensus sell-side estimates for the same company KPIs. This allows investors to quickly compare estimate gaps across datasets and cohorts and identify the largest gaps on the fly.
Investors can pair any dataset, model, or cohort against anything else, to identify the best model and cohort to use for any KPI in real time. For simplicity in this example, we will choose IDEA as the dataset for both estimates. The IDEA dataset is a combination of all the data you have access to and will vary from investor to investor depending on their subscriptions. This works well even if you have just one dataset but becomes even more powerful if you have several. For this example, we will choose the most commonly used SP (one-year spread) model against an optimized combination of models (IDEA.) This will isolate the difference in estimates between the two model types: standard (what the market sees with this data) and optimized, highlighting the opportunities you can exploit over a consensus formed with the standard model. The upper left section shows the KPIs where IDEA is more bullish than SP and the bottom right shows KPIs where it is more bearish on the estimate.
Several of the outliers are interesting, but let’s look at one in specific. We have selected one of the most bullish outliers on the upper left quadrant (circled in red). This is an actual stock, please reach out to learn the ticker.
This KPI tracks Total Revenue for a US-based consumer company. Incredibly, the standard model predicts a significant miss against the sell-side consensus for the second Q of 2024: 6.4% below sell-side consensus, while the IDEA model predicts a solid beat. But can we trust our model over the standard one? Let’s expand the record in the table.
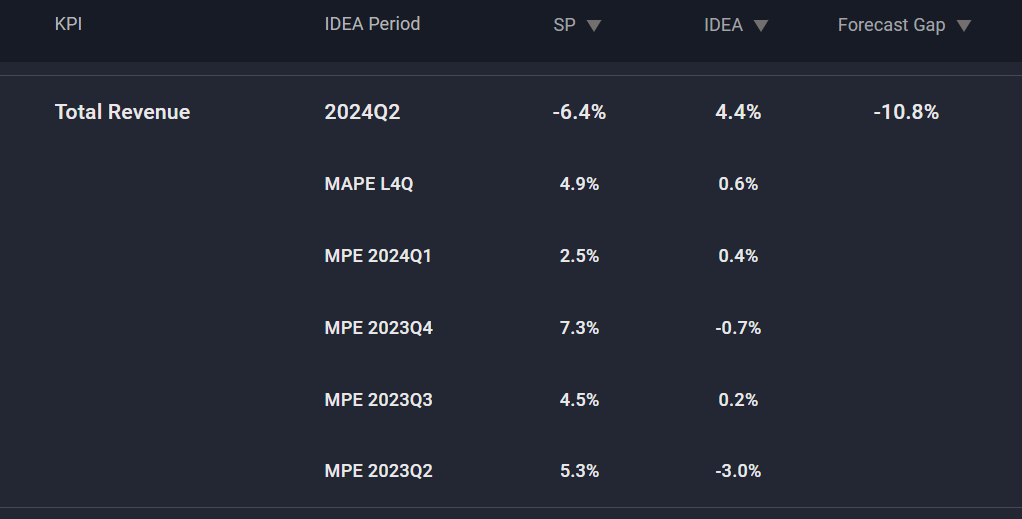
Looking at the recent MAPEs, we can see how much better the IDEA model is than the standard model. This gives us two pieces of knowledge: 1. the standard model predicts a miss while our model predicts a beat, and 2. Our model is better.
Armed with this tool, investors with just one dataset can use the data to identify the consensus view and come out with a better estimate than their peers who are simply looking at the data in isolation. This strategy works particularly well with with a popular dataset. The analysis does become even more powerful once we add more data but even with one dataset alone there are plenty of situations where the standard model and the optimized IDEA models diverge creating compelling opportunities for the investor.
How does this work for your names? Find out in a live demo: contact us.