4 min read
For Modeling KPIs with Alternative Data, spreadsheets just don’t cut it

Don Wood
CRO


Your tools matter. Especially if you are working in the hyper-competitive and high-stakes world of hedge funds. The tools analysts use to model Key Performance Indicators (KPIs) with Alternative Data determine how broad and how deep they can take their analysis and how far they can trust their forecasts. Traditional spreadsheets like MS Excel are familiar and flexible and can help whip up a simple model in no time. But as needs evolve, the limitations of spreadsheets make themselves painfully obvious. In short, models built with spreadsheets don’t scale.
Maintenance
With a spreadsheet, updating a large dataset is an error-prone chore, even if you have some VBA automation built in. Sources change their structure and formats, links break, and calculations get tangled in a complex web of links and references that tend to break at exactly the wrong time. If you are doing a lot of copy-pasting and F9 routines, you can be investing your time better.
Scale
If you are only covering one or two stocks, excel might be fine for a while. But as soon as you add to your watchlist, build a peer group, or expand your coverage to a dozen or more names, the spreadsheets, and tabs you have to manage grow exponentially. You may be forced to keep copies of the same underlying data on dozens of spreadsheets, remembering to update them all when the time comes for a quarterly call.
Furthermore, limiting yourself to just one dataset per stock is not ideal. As we have shown, the accuracy of forecasts grows as you increase the number of datasets in your model. Unfortunately, Excel is not built to handle different datasets with varying formats and frequencies. Combining large datasets together with formulas in a spreadsheet quickly gets out of hand even for the most savvy Excel users.
Speed
Excel has over 1 million rows, but anyone who’s tried running formulas on even half that knows how excruciatingly slow it can be. Alternative Data is notoriously big, with some datasets that will not even open in a spreadsheet. But even with aggregated data from vendors, spreadsheets hit their limits very quickly and become next to unusable with time.
Collaboration
Analysts who lean on Alternative Data for their investment thesis and idea generation need a way to communicate their findings to the rest of their team. Though recent features do allow for better collaboration inside spreadsheets, excel is still just a spreadsheet, not built with today’s collaborative workflows in mind. You have to generate tables and charts, export them to PowerPoint or the like, and then package them in a presentable PDF. Doing this over and over again costs you precious time.
Why scalable tech is the future for Alternative Data consumption
Maiden Century’s IDEA platform presents a compelling solution to the challenges faced by Alternative Data analysts using traditional spreadsheets. With over 5,000 KPIs updated daily, IDEA offers a level of comprehensiveness, breadth, depth, and scale that spreadsheets simply cannot match. Let’s explore the key advantages of ditching your spreadsheet models and switching to the IDEA platform:
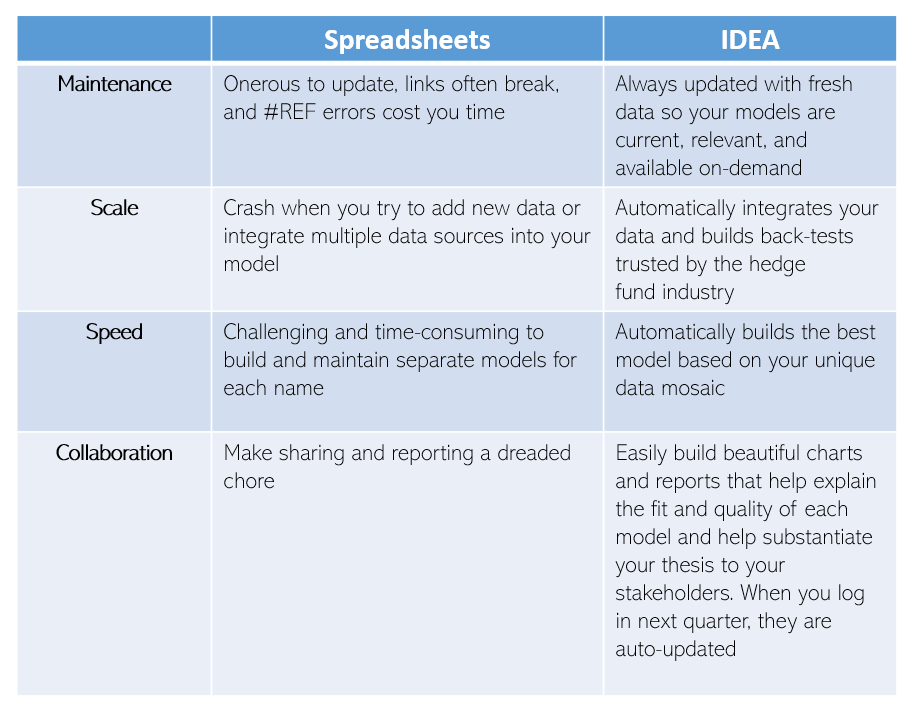
- Always Current Data: Unlike spreadsheets that require manual updates—often leading to broken links and REF errors—IDEA is continuously updated with fresh data. This ensures that your models remain current, relevant, and ready for on-demand access, saving you valuable time and reducing the risk of making a mistake during a data refresh.
- Seamless Data Integration: Spreadsheets are notoriously fragile when it comes to integrating new data or combining multiple data sources, frequently leading to crashes and corrupted files. IDEA, on the other hand, automates the integration process, allowing for the seamless incorporation of diverse data sets. This automation is particularly beneficial for backtesting, a process that the hedge fund industry relies on for developing investment strategies.
- Customized Modeling: Building and maintaining separate models for each investment can be a daunting task with spreadsheets. IDEA simplifies this process by automatically constructing the best model based on your unique data mosaic, thus enabling more robust and accurate investment analysis. The backtesting and model building happen in the background while giving the analysts transparency on how the model is built.
- Effortless Sharing and Reporting: One of the most significant drawbacks of spreadsheets is the difficulty in sharing and reporting. IDEA addresses this issue by giving analysts the ability to create beautiful dashboards and reports that help communicate to stakeholders. Additionally, these reports are auto-updated, ensuring they remain relevant for future presentations.
Embracing Change
The transition from spreadsheets to a platform like Maiden Century’s IDEA represents a significant shift in how hedge fund managers approach data analysis and investment strategy development. Any change requires a leap of faith, especially if it means leaving the familiar comfort of an old reliable tool. But by embracing this change, analysts can finally free themselves from the “spreadsheet hamster wheel” and leverage a more efficient, accurate, and scalable solution. The IDEA platform not only streamlines the data analysis process but gives you the clarity to make better investment decisions.
Ready to chat? We’d love to hear from you!